
API Connector Documentation
Set Report Style
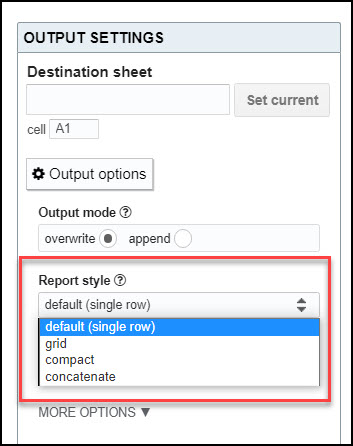
Spreadsheets present data in a table, while APIs typically send back data in a tree-like structure containing nested JSON data. The API Connector add-on for Google Sheets provides four main report style options for converting these nested JSON responses into a tabular format for Google Sheets.
Contents
- Before You Begin
- JSON Example
- Style 1: Default (Single Row)
- Style 2: Grid
- Style 3: Compact
- Style 4: Concatenate
Before You Begin
Click here to install the API Connector add-on from the Google Marketplace.
JSON Example
Let's consider the following simplified example, with 2 orders each containing 2 products. The underlying JSON looks like this:
{
  "orders": [
    {
      "order_id": "order123",
      "products": [
        {
          "id": 111,
          "name": "Product A"
        },
        {
          "id": 222,
          "name": "Product B"
        }
      ]
    },
    {
      "order_id": "order456",
      "products": [
        {
          "id": 333,
          "name": "Product C"
        },
        {
          "id": 444,
          "name": "Product D"
        }
      ]
    }
  ]
}
Style 1: Default (Single Row)
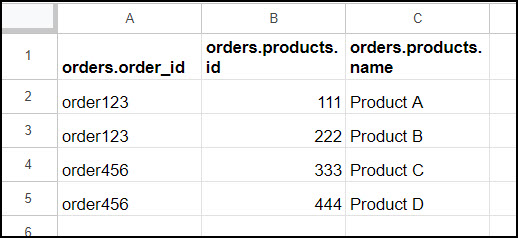
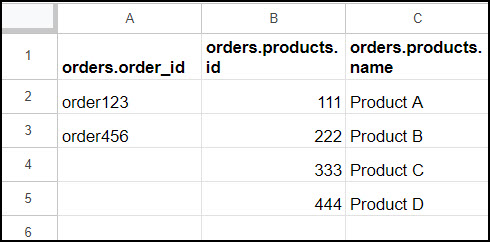
The default (single row) report style produces separate columns for the nested product data, each identified with a number. This ensures that all values can be associated with their parent value (in this case, the order ID).
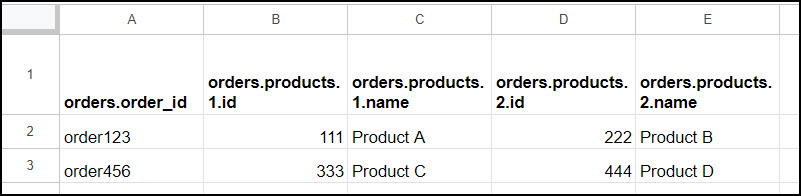
Note that 'single row' style doesn't mean that all data must be printed into a single row; rather, it means that each element of an array gets its own row.
Style 2: Grid
The grid report style keeps each header field in its own column rather than flattening it out to separate columns.
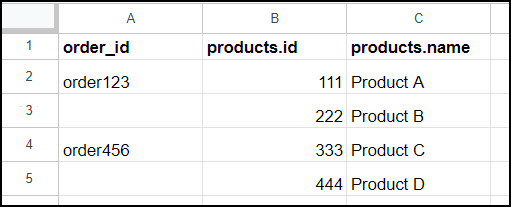
Grid style enables several additional options: unwind, force rows, repeat rows, and combine simple arrays.
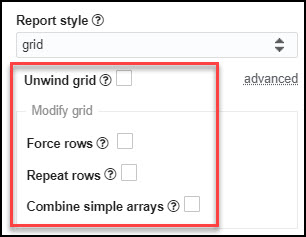
Grid style option #1: Unwind data
The "unwind data" option flattens more deeply nested data as well, creating new rows for each value in an array. When grid + unwind is selected, the output will look like this:
The "unwind" algorithm is described in more detail in the MongoDB documentation.
Grid style option #2: Force rows
The "force rows" option checks for the case in which all data is located within objects. One example would be{"rates":{"btc":{"name":"Bitcoin","unit":"BTC","value":1,"type":"crypto"},"eth":{"name":"Ether","unit":"ETH","value":19.562,"type":"crypto"}}}
A second example would be {"A":"2","B":"0","C":"2","D":"2"}
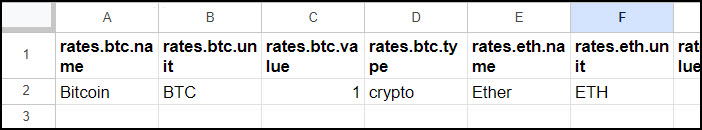
These data structures normally result in data displaying in a long row, with a new column for each nested element:
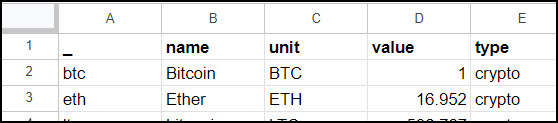
When "Force rows" is checked, API Connector will instead attempt to force data to display in rows by automatically converting these objects into arrays. The output will then look like this:
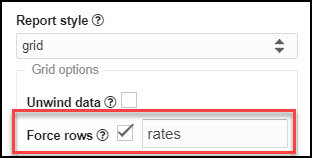
If the auto-detection doesn't work as expected, or you'd like to override it, use the text field to enter the path to the data (using dot notation) that should be displayed as rows instead of columns. In the first example above, the path would be written as rates, since rates is the name of the object that should be forced to display in rows. In the second example, the path would be a single period, i.e. . , since the object has no name.
Grid style option #3: Repeat rows
Repeat rows copies down the outermost element, filling in empty cells. In this way it is similar to the "unwind" data option, though it is a much less resource-intensive process as it doesn't create a new row for each combination of data. This can be a good solution for data sets that time out when "unwind" is selected.
When selected together, "Repeat Rows" + "Combine simple arrays" are equivalent to API Connector's deprecated grid mode.
Grid style option #4: Combine simple arays
This will reduce total data size by combining values from simple arrays into a single cell. An example of a simple array would be {"colors":["Green","Ginger","Coffee","Grey"]}
With this option set, these values will be displayed like this:
Without this option, each value will instead be expanded into its own row:
Style 3: Compact
Like grid style, compact report style lists all associated values in a single column, and will return data into the first available empty cell. This breaks the association with the parent element (the order ID) but is convenient when you're primarily interested in counting, processing, or matching up elements within the nested line items themselves, since the data will be displayed in a single column rather than split among separate columns. It can also be useful if you're NOT interested in those nested elements, since it will produce fewer columns to work around.
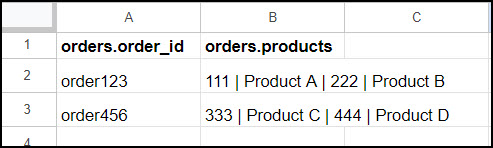
Style 4: Concatenate
The concatenate report style will concatenate all the elements of each nested object together. This will produce a super-compact report with all nested elements in a single cell.
HI this has been really helpful. but I was wondering for multiple orders is it possible if it can merge the cells. That way it becomes really easy to read multiple products in an order.
That way when we use banded rows its very easy to read.
I'm very close to releasing a new report style that should help! It will copy down outer elements to form a grid, so in this example, the order ID will be copied down for each product in the order. I think that will address your request.
The grid report style is now available.
How we go about obtaining data only into a cell and dropping the header? I'd like to use it to update other formulas, but the header is problematic to that. Orders.order_id, and orders.product (from your examples) wouldn't appear in the top row (or at all), is what I'd like to do. Starting off and learning, so I apologize in advance if it's pretty basic.
Hey David, you can click Edit Fields before running your request and delete the text from each header in the editor. Once you do that, data will print without the header row.
Update: There's now a "Remove header row" option
Hello Ana,
Thank you for all the kind help. On this subject, it seems I'm not able to delete the text and leave a blank header using the editor. Any advice?
That's odd, I just tested and confirmed it still works on my side. Can you please make sure you enter a blank space before hitting Save?
Hi Ana,
I am assuming there is a bug in the report style function.
Grid and compact style giving me same style result which is compact.
I'm not aware of any bug, but there may be something about the original JSON that makes our parser unable to produce the desired structure. If you'd like to send some sample JSON to support I can take a look, we may be able to resolve the issue with a JMESPath expression.
Is there a way to only unwind specific fields / arrays? I'm importing ShipStation data and want to list each SKU for each order on a different line but it is currently also duplicating every line for each tag I have assigned to each order, making many duplicate lines of a SKU per order.
We can't unwind specific fields per se (that's a great idea for the future, though). However we should be able to work around this issue with a snippet of JMESPath. I'll need to see an example of the underlying JSON so let me message you separately about that.
Hello!
I have a question when trying to extract data from my Mailchimp.
I need to obtain a list of results in a column
This is an excerpt from my RESPONSE API.
{"members": [
{
"id": "c82718062df218aa996a236b24e71c53",
"email_address": "[email protected]",
"unique_email_id": "26d5593726",
"contact_id": "e82edaf82f819bf2428993ecef5316e8",
"tags_count": 2,
"tags": [
{
"id": 6456208,
"name": "TAG NAME 1"
},
{
"id": 6452736,
"name": "TAG NAME 2"
}
],
"list_id": "2f175baf59",
]
},
What I need to get is a list of the tag names, in a single cell of the sheet (separated by a comma if possible), like this:
TAG NAME 1, TAG NAME 2
Can somebody help me?
thank you so much
Can you please try pasting in the following JMESPath expression? (under Output options):
members[].{id:id,email_address:email_address,unique_email_id:unique_email_id,full_name:full_name,tag_name:tags[].name}Switch to the grid report style and all the tags should be joined into a single comma-separated cell. Let me know if that gets you what you're looking for.
Is there a way that I can retain the JSON object format from the API Call? I don't want Mixed Analytics to do any parsing of the JSON object for me.
The entire API response is usually a JSON object/array, so Mixed Analytics has to do some parsing to get the response into the sheet, but if you just want to see the original raw JSON without any parsing, you can do so as described here: View Raw API Response.
Is it possible for the API Connector to store the entire API Response in 1 cell in google sheets? For example I'd like the picture I attached to show up in a single cell (like A2) and then I can easily parse that apart in BigQuery. Is this an option?
Sorry, that is not an option. API Connector automatically processes the response and converts it into a table format, and there's no way to disable that behavior (I don't think pushing the entire response into a single cell would work in many cases anyway, since individual cells are limited to 50k characters.)