API Connector Documentation
Create a Request
API Connector includes a built-in directory of popular and interesting APIs. For this quick start, we'll fetch data from one of the preset integrations available through the directory.
If you like videos, also check out this video guide to using API Connector.
Contents
- Before You Begin
- Step 1: Open the Sidebar
- Step 2: Add a New Request
- Step 3: Select an API
- Step 4: Set Authentication
- Step 5: Select an Endpoint
- Step 6: Set Parameters
- Step 7: Set a Destination Sheet
- Step 8: Choose Output Options
- Step 9: Edit Fields
- Step 10: Name and Run
Before You Begin
Click here to install the API Connector extension from the Google Marketplace.
Step 1: Open the Sidebar
After installing the plugin in Google Sheets, click Extensions > API Connector > Open
Step 2: Add a New Request
Once the sidebar opens, click Create request to start a new request.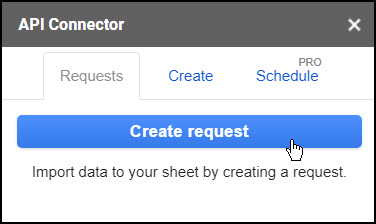
Step 3: Select an API
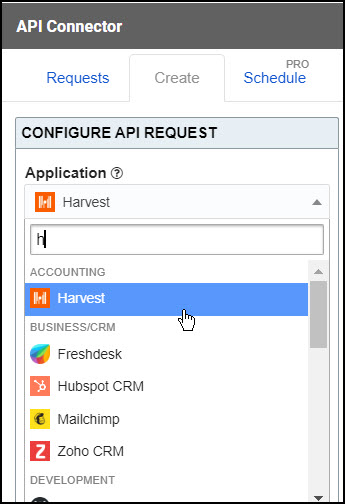
To access the directory, browse or search for an application in the application menu.
Step 4: Set Authentication
Authentication requirements will vary by API:
- Open APIs don't require any authentication at all. They are marked with a green "unlocked" icon.

- OAuth APIs can be connected to by clicking a blue Connect button.

- Some APIs require header keys or tokens. In these cases, enter the value into the input field. Additional instructions are provided in the Auth Info link.

- Some APIs use query string parameters. These can be entered in the parameters section.

Step 5: Select an Endpoint
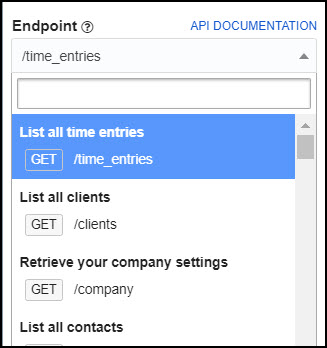
Each API's data is organized into endpoints, which can be thought of as individual data sets or tables. Select an endpoint from the dropdown menu.
Step 6: Set Parameters
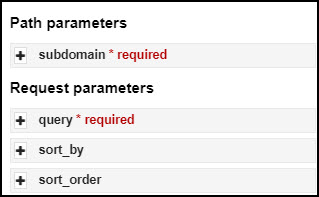
All available parameters will appear below the associated endpoint. Any required parameters will be marked as such, while other parameters can optionally be used to filter and customize the response data.
Step 7: Set Destination Sheet
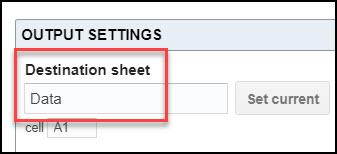
Enter a destination sheet or click Set current to send the response data to the currently focused cell.
Step 8: Choose Output Options
(optional) Click the Output options button and customize your request. Options include setting the output mode to overwrite vs. append, choosing a report style, applying pagination, and more. 
Step 9: Edit Fields
(optional) Click the Edit Fields button to preview your request. This will bring up a preview window where you can map fields to specific columns and choose which fields to display in your sheet. 
For more information on the visual field editor, see here: Edit Fields
Step 10: Name and Run
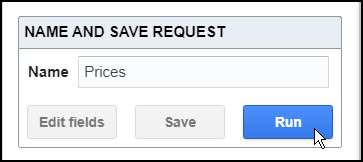
Give your request a name and click Run.
Questions?
Please leave a comment below, contact support, or leave a message in the API Connector user community. You'll receive a response shortly.


Hi Ana
Great Add on to Sheets, Thanks a lot for providing!
I d like to use API Connector with my Kraken Account. I have created a API privat Key there. But now using it, trying to find the url and the right way to paste the PRIVATE Key the in the correct fields. Can You help?
Hi there, Kraken's API requires a more complex form of authentication than a key to access private data, you can see their requirements here. They require that you apply the HMACSHA512 hashing algorithm to a signature generated with your private key, nonce, encoded payload, and URI path. So you'll need a script or connector developed for Kraken as we dont have native support for that, sorry.
how should I get the private data Ans the complex authentications than a key to access private data, you can see their requirements here. They require that you apply the HMACSHAA512 so you'll get the all URL l path and the authentications key and the access private key from the data you can see their requirements here
Sorry, I'm not sure I understood this, can you please restate the question?
Hello.
Thanks for the great addition!
Can you please tell me how to auto-update once every 5 minutes?
Thanks.
Sorry, we only offer 1x per hour max scheduling. You could create an IMPORTAPI request and set the sheet to update every minute, though.
Hello.
Thanks for the answer. But I can't find information about the IMPORTAPI request anywhere. If you don't mind, could you tell me more about how to do it? This may be useful to future readers of this article.
I will be very grateful to you)
Sure, you can read about IMPORTAPI here: https://mixedanalytics.com/knowledge-base/importapi-custom-sheets-function/
I got it. thank you very much!
Hi friends! really excited about this extension. I will try to connect my federal user account to the System for Award Management /SAM.gov. I am a government contractor and use various government websites to get reports on opportunities and perform market research, among other things Open.gsa.gov is where all of these APIs are. Hope Im able to finally connect with these data services that they offer to federal account users like myself.
Thanks, Ronnie! https://open.gsa.gov/api/ looks like an amazing resource, thanks for sharing it.
HI when i get to the guide step that says Edit Fields, the Google sheets is named and ready to go but clicking edit Fields gives an error when it tries to connect the data sets to start mapping, do you know why there is an error here?
1) ABCVisitorsLog: Completed with errors
- We received an error from googleapis.com (403) show response
{ "error": { "code": 403, "message": "Request had insufficient authentication scopes.", "status": "PERMISSION_DENIED", "details": [ { "@type": "type.googleapis.com/google.rpc.ErrorInfo", "reason": "ACCESS_TOKEN_SCOPE_INSUFFICIENT", "domain": "googleapis.com", "metadata": { "method": "google.analytics.data.v1beta.BetaAnalyticsData.RunReport", "service": "analyticsdata.googleapis.com" } } ] } }
OK
This generally means you haven't allowed Mixed Analytics access to the permissions it needs to run the request. Can you please disconnect and reconnect to GA, making sure to tick any checkboxes that appear in the login modal, as well as Allow?
good
Hi,
I'm not sure if it's my configuration but I seem to only be able to get short responses (30 characters or less).
Any limits that I'm unaware of or anything you can point me in the direction of?
Amazing tool, very excited to get stuck in.
Thanks,
Greg
I'm not totally sure what this is in reference to, but it sounds like it might be OpenAI :). In that case, can you please increase the value in the
tokenparameter?Hi Ana,
Yes, it certainly is Open AI. Thanks for mindreading .
Ok, I'll try that now. I do seem to be getting far better results now with max_tokens set to 2000 vs the default of 18.
Thanks for your help!
Can you create a Request URL, or part of a URL, based on data from a given Sheet/Cell?
Sure, just wrap the cell reference piece with 3 plus signs, like this:
+++Sheet1!A1+++More info: Use Cell Values in Requests
Hi Ana! I am trying to connect to Altegio API (https://developer.alteg.io/api). It is not on the list of apps available in the dropdown. Can I still use API connector to set it up?
Hey Alma, sure, API Connector connects to almost any API, though each API may have its own requirements. In this case, Altegio's docs say that you'll need to do the following:
1. Contact their support to get a "partner key"
2. Once you get it, use that partner key to get a user key as described here
3. Run data requests by including both keys in a header where Key=
Authorization, Value =Beareryour_partner_token,Useryour_user tokenFeek free to reach out to our support if you need help with any of the above steps.
Hi, I use a platform for print on demand called Gelato, here is their documentation for their api https://dashboard.gelato.com/docs/
Can you walk me through how I can connect it so that I pull number of orders and product costs?
Sure, looks like you need to first get an API key by logging into Gelato and clicking Developer > API Keys
Then open API Connector and set up your request like this:
Application:
CustomMethod:
POSTRequest URL:
https://order.gelatoapis.com/v4/orders:searchHeaders:
Key =
X-API-KEY, Value =your_api_keyRequest body:
{"financialStatuses":["paid"],"limit":100}In the request body, you can also include other filtering parameters like dates as shown in their docs.
Hi, really useful for our reporting! Thanks for all the hard work. One question: the 'CostinLocalCurrency' pulls in the amount spend in a certain period, however the data is not being read as a currency. 927.06 euro is being displayed as 9270599999999990. Any ideas how to fix this in the spreadsheet or in the api?
Thanks, Rogier! API Connector prints out whatever the API sends back, so it looks like this API returns data in units of less than a cent (you can verify by clicking Edit fields and viewing the raw API response). To correct for this, I suggest setting the data destination to cell B1, and then adding the following formula to cell A1:
=arrayformula(if(B1:B<>"",B1:B/10000000000000,"")). ChangeB1:Bto whichever column holds your CostinLocalCurrency value. Note that this is in array formula so you only need to enter it in one cell only. It will automatically apply itself down the entire column, converting each value to the level of decimal you're looking for.Update: You can now use formulas directly within API Connector (https://mixedanalytics.com/knowledge-base/choose-and-edit-fields/#editfields-formulas)
Hello, can I connect my amazon and mercadolibre accounts? I want to see my sales and advertising 🙂
Check here for information on connecting to Amazon: Import Amazon Seller Data to Google Sheets. As for Mercadolibre, you should be able to do it with a custom OAuth connection, I wrote some info about it here.
Hi, i'm trying to connect to a custom API that requires a JSON be sent as a raw body to the GET request and I was unabled to find a way to do this with the API Connector.
Is there something i'm missing or is this a not supported feature?
Will this option be added in the future?
Here's a cUrl example of what i'm trying to do:
curl --location --request GET 'API-URL' \--header 'Authorization: Basic AUTH-TOKEN' \
--header 'Content-Type: application/json' \
--data-raw '{"paginator": {"page": "0","size": "50"}}'
Hey Luiz, API Connector doesn't support GET requests with request bodies. That's a very unusual requirement for an API, is it possible to share a link to their documentation? I'm curious why they've structured their API this way (and wondering if it's something we should support in the future).
Hey,
I am not able use API connector. After install API Connector Help button show only.
How to fix it.
Please suggest
That’s just a temporary glitch on Google’s side. Please refresh your sheet once or twice and you should see the full menu appear.
Hello
In my google Sheet there is not show API connector after i click extension bottom.
If you've installed API Connector but don't see it, make sure you're logged into Sheets with the same Google account from which you installed it. Also, refresh your sheet as sometimes Google has a glitch in which extensions don't show up the first time you load your sheet. If you're still having issues, please feel free to contact support.
Hello,
My api provider can give me 100 records at once. So I have to set the start id too, which requires me to change the api url.
Can I add a cell reference in sheet where I specify the api url? So I can fetch new records every time I refresh.
Oh, I just saw the IMPORTAPI function. You've already done much more than what I needed. you are awesome.
Great, and I think you can check out pagination handling too as that is designed specifically for cycling through multiple pages of data.
Hi all -
Is there a way to use a Sheet cell reference in the API call? I want to populate a column on the spreadsheet based on data related to another cell, in this particular instance getting the publicity image for a movie from the iMDB RapidAPI database based on the movie name in the A column. Thanks in advance
Sorry, just saw the "Use Cell Values In Request" topic. As we've all often said, "RTFM buddy!"
hahahha, I would not have said that! 😀 But I'm glad you found it, and just let me know if anything isn't clear.
Hi. Once the data is filled into the sheets successfully does a new row add itself automatically everyday? Or do I have to click 'run' every time I want the new insights to be visible?
Just realized that I have to create trigger for that on the 'Schedule' tab. But, for instance, the Fb Posts Request only gives 100 posts. So next time it's triggered to run it'll overwrite the previous data and give me the next 100 posts making me lose that last 100 ones? Or will it write below them so I now have 200 posts' data?
Just came across the 'append' option!
Great! Yes, you can choose whether to append, overwrite, or merge your data. Feel free to contact us if you'd like more specific help or further clarification.
Hello! I love this!! How do I format a number field? I'm getting 2000 instead of 20.00. Using Etsy integration.
Thanks, Gloria! API Connector just returns the data as it comes back from the API, and they return the data using the smallest unit (i.e. cents), such that $20 is represented as 2000. To convert it to 20.00, I suggest setting a data destination of cell B1, and then entering the following formula into cell A1:
=arrayformula(if(B1:B<>"",B1:B/100,""))Where it says
B1:B, replaceBwith the column letter containing your number field. This will automatically apply itself all the way down your sheet so you only need to enter it once.Update: You can now use formulas directly within API Connector (https://mixedanalytics.com/knowledge-base/choose-and-edit-fields/#editfields-formulas). Dividing by 100 is on the list as a preset.
Thanks so much Ana!!
Hello All,
I am getting this message in google sheets when i try and open api connector. "Message details
We're sorry, a server error occurred while reading from storage. Error code PERMISSION_DENIED."
Thank you
Danny
That's an error message from Google, and, based on this, I believe it's related to being signed into multiple Google accounts at the same time. Can you please try opening the extension in an incognito browser session or a separate Google Chrome profile?
Working now. Thank you
Is it possible to use api connector to connect to interactive brokers client portal api? I was able to connect without api connector and to get requests in json data but with Api connector I get an error:
Completed with errors
- DNS error: https://localhost:5000/v1/api....
two-factor authentication is mandatory for login. Is it safe to get this kind of data using api connector?
Hi Zohar, there is no way for API Connector to connect to a localhost address, as it can only connect to webhosts available through the internet. As for Interactive Brokers in general, I found this page on their site which says they authenticate using the old OAuth 1.0 standard, which isn't supported by API Connector, so I don't think you can connect to them through our connector (API Connector currently only supports OAuth 2.0 and API keys/tokens).
In Google Sheets, suddenly the API CONNECTOR is not working, I keep getting #NAME? error, it's not working, please help.
Google is currently experiencing an outage that affects all extensions. Please check here for updates: https://support.cloud.google.com/portal/system-status?product=WORKSPACE
Edit: This issue has been resolved
I'm getting this: {"error":{"message":"(#100) Tried accessing nonexisting field (accounts) on node type (Page)","type":"OAuthException","code":100,"fbtrace_id":"AK9ysju4TLabLCJS4EKABWu"}}. Any advice?
Hi - we've sent you a follow-up email asking for your request details in order to see what the issue is.
I try to fetch Data from CoinGecko. Unfortunately I can only fetch 250 lines with the market data via the Connector. Also I tried to use pagination with different options. But nothing helped so far. Can you support?
Hi - please use page parameter pagination, as specified in our CoinGecko how-to guide: https://mixedanalytics.com/knowledge-base/import-coingecko-data-to-google-sheets/
HI,
Can i extract Redcap database or report in
Hi - yes, it looks like there is API documentation available:
"A replication of the documentation available at https://YOUR_REDCAP_INSTALLATION/redcap/api/help. Another way to click on the API Documentation link in the "Technical / Developer Tools" section of the menu (in the Control Center of your institution's instance)."
https://redcap-tools.github.io/projects/
Solid! I just need to sort out the output. Fantastic tool!
how does one setup a custom auth for something like swagger w only a bearer value ? the values like client id and secret dont exist
Hi - you can set up bearer authentication just by using request headers. You don't need to set up a custom auth.
https://mixedanalytics.com/knowledge-base/api-authentication-explained/#bearer
Hi Ana,
I use a trading platform called Valr, link to their api documentation here https://docs.valr.com/.
Would appreciate a step by step on how to pull a live rate on a trading pair please?
I have already generated my API keys but am low-tech and don't know how to proceed from here. Thanks in advance.
Hi Lucia - it looks like Valr actually supports this endpoint without any documentation: Just enter the request URL e.g. https://api.valr.com/v1/public/BTCUSDC/marketsummary, with any currency pair you would like.
Here is the endpoint documentation: https://docs.valr.com/#89b446bb-60a6-42ff-aa09-29e4918a9eb0
Can't wait to see what you are capable of